Growth plan for Crazy Compression, 5 Oct 2026
Scale spend. Hold CAC.
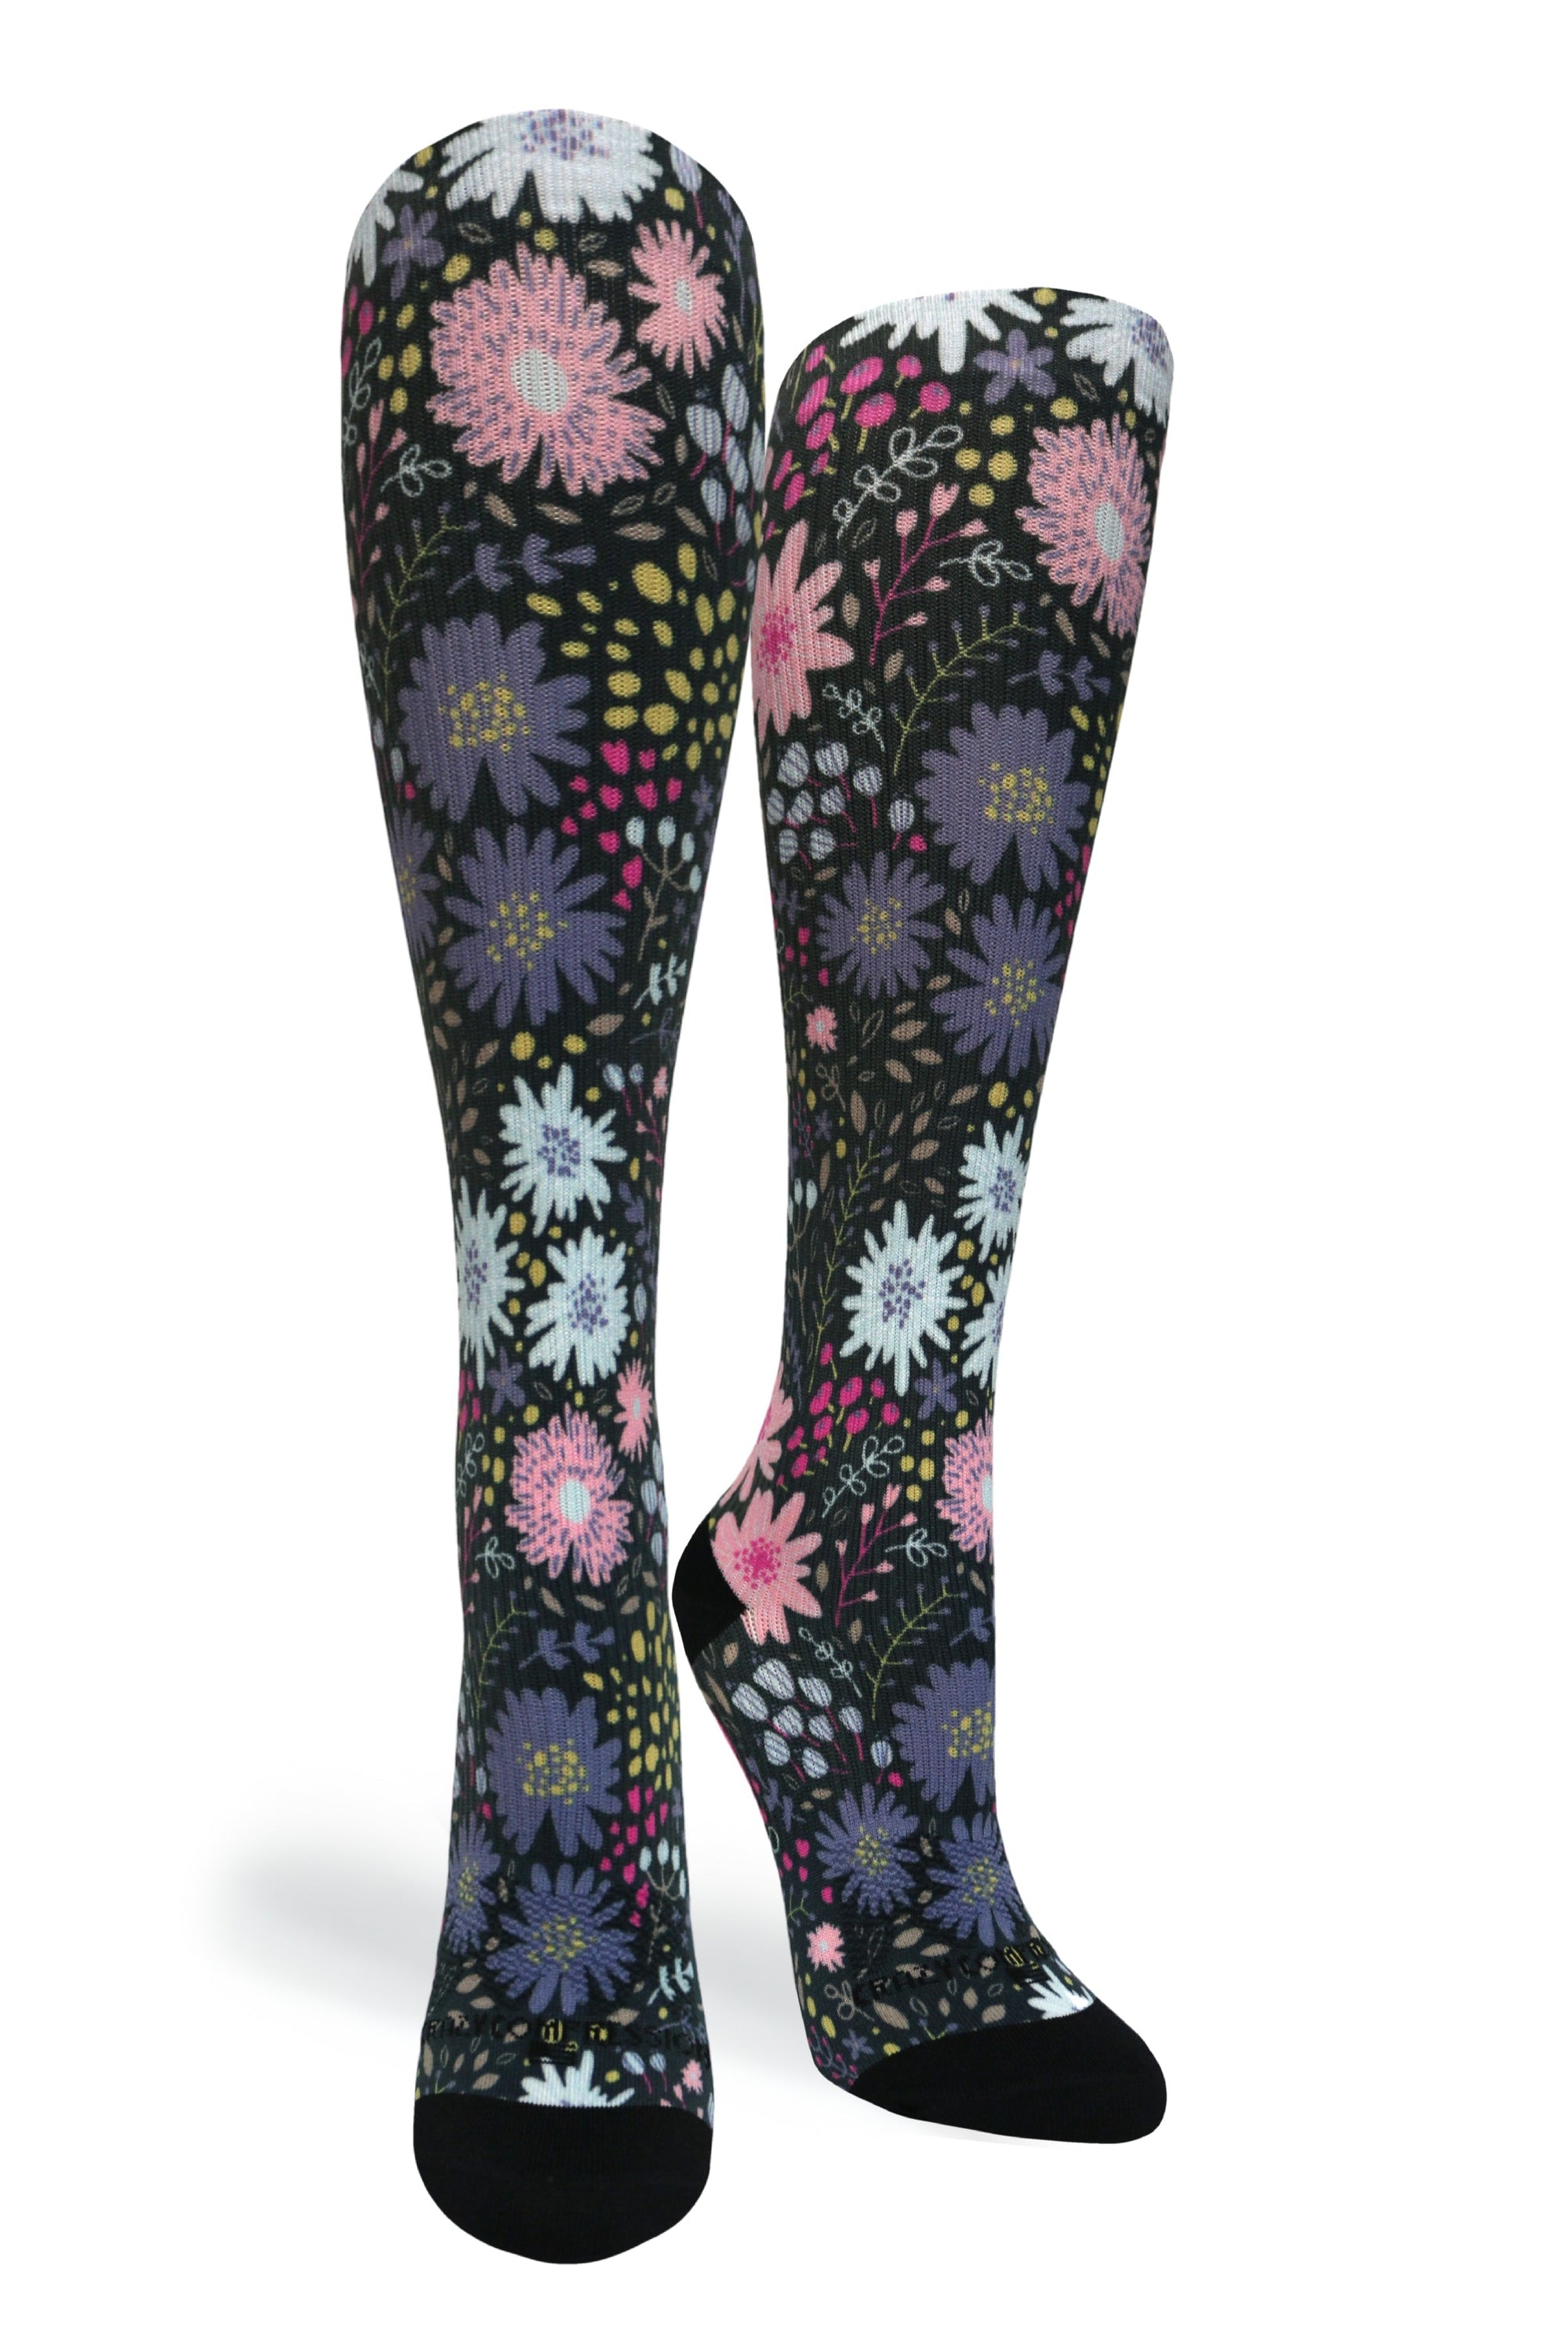
One number to protect: a target CAC of $10.08. Crazy Compression has dozens of printed pairs at $20.95 and free shipping over $90, so the plan is to test ads fast, kill losers early, and scale only what holds that line.
- Target CAC
- $10.08
- New ads a week at peak
- 20
- Creators live by week six
- 10
- Test spend, six weeks
- $24,000
Contents
10 chapters, then the gates and every number’s source.
01 The number
Hold CAC at $10.08 while a pair sells for $20.95
The number is a target CAC of $10.08. It is 0.6 of the $16.80 ceiling, which comes from a $21 average order, a 40% margin and one repeat order. Those inputs are my guesses until week one replaces them with your data.
Protect
Target CAC: $10.08 on a first purchase
Ceiling = average order × margin × (1 + repeat orders): $21 × 40% × (1 + 1) = $16.80. Guard line = 0.6 × $16.80 = $10.08. Across the ranges: $5.25 to $209.25.
Three moves
- Kill any ad that cannot get near $10.08 after its first test, and keep one variable per test.
- Lead with the prints that have a clear occasion, such as Spooky Season or Starscape, and send each to its own landing page.
- Use the free shipping line over $90 to pull baskets toward the 10 Pairs (US) bundle at $100.00 instead of single pairs.
- Price of Warming Stripes and dozens of other printed pairs
- $20.95
- Published
- Variants on each printed pair
- 12
- Published
- Fall sale banner, with code FALL75
- 75%
- Published
02 Variety
Dozens of prints give each ad its own reason to buy
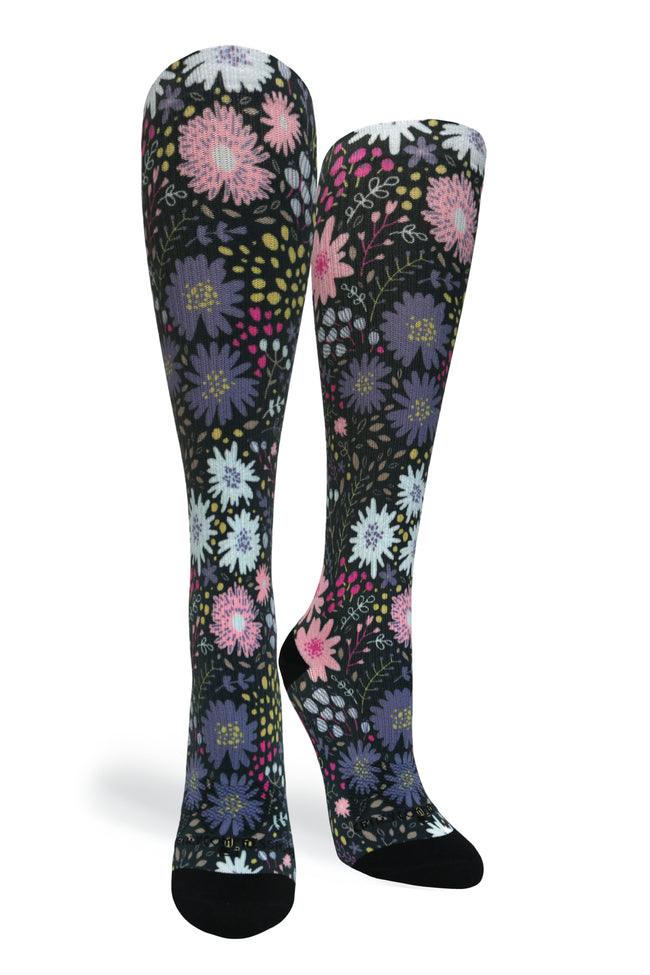
Each ad concept has to carry one reason to buy a pair: an occasion, a print, a pack or a runner's need. The catalog gives me holiday, summer, patriotic and fiesta designs, so one variable changes per test and the winners show which reason pulls.
| Reason to buy | Proof you already have | Ads (proposed) |
|---|---|---|
| True graduated compression | True Graduated Compression | 6 |
| Made in the USA | Made in the USA | 3 |
| Lifetime guarantee | Lifetime Guarantee | 3 |
| Stay Cool Technology | Stay Cool Technology | 2 |
| Seamless toe | Seamless Toe | 2 |
| A customer review | Best socks! They fit perfectly! | 1 |
| Free shipping over $90 | Enjoy free shipping on all orders over $90! | 1 |
| Total | The ad concepts tab | 18 |

Each row is a reason to buy that the brand already has proof for. The count is how many of the ads carry it: a reason with a single ad is a bet, not a pattern, and the next batch of concepts moves toward the reasons that win.
03 Disturbances
Free shipping over $90 can hide a weak first order
| Disturbance | Likelihood | Impact | Owner | Gate (proposed) |
|---|---|---|---|---|
| The $78.00 struck price may read as inflated and hurt trust on the first order | Med | High | Your team | Conversion on the test page beats the control by week four, or the struck price comes off the ads. |
| The $21 average order is a guess; baskets may skew to single $20.95 pairs | High | High | Me | Week one replaces the guess with real orders; I recalculate the ceiling before spend rises. |
| Free shipping over $90 may cap baskets just under the line and cut margin | Med | Med | Your team | Share of orders over $90 reported weekly; if it is flat by day 30, test the 5+ Items offer. |
| Seasonal prints like Spooky Season and Fourth Celebration go stale when the holiday ends | High | Med | Both | Every seasonal concept has an end date; I pause it when its CAC stays above $10.08 two days running. |
| Tracking gaps hide which ad drove which order | Med | High | Your team | Purchase events match store orders within a few percent before cumulative test spend passes $10,000. |
| Creators post off-brief or late, so videos fall behind the ramp | Med | Med | Me | Videos live each week match the ramp; two weeks behind and I recruit replacements. |
| Ad claims about compression drift past the brand's own wording | Low | High | Both | Claims sheet approved before launch; any health line uses only the brand's own words. |
Scores are my read from outside the company, re-scored in week one with your data. Each risk has one owner and one gate that can be checked with a number, so nobody has to argue about whether it happened.
04 The ceiling
The ceiling is $16.80 on a $21 order, and week one tests it
| Line | Value | Status |
|---|---|---|
| Average order | $21 (range $10.00–$155.00) | Assumption Range from the site product prices (Published); the midpoint is a guess |
| Gross margin | 40% (range 35–45%) | Assumption Replace in week one |
| Repeat orders after the first | 1 (range 0.5–2) | Assumption Replace with cohort data in week one |
| Margin per customer, all orders | $16.80 | Calculated Average order × margin × (1 + repeat orders) |
| Guard line for CAC | $10.08 | Calculated 0.6 × the margin per customer |
The math, with the assumed lines
Ceiling = average order × margin × (1 + repeat orders): $21 × 40% × (1 + 1) = $16.80. Guard line = 0.6 × $16.80 = $10.08. Across the ranges: $5.25 to $209.25.
Range across the assumptions: $5 to $209.
The $21 order, 40% margin and one repeat order are guesses; the $16.80 ceiling and $10.08 guard line follow from them. Week one replaces them with your real numbers.
The ceiling is a range, not one number: the most a new customer can cost before shipping and packaging, which I do not have. Replace the guessed lines with yours and every figure below recalculates.
05 Test ramp
Six weeks of tests add up to $24,000, not a leap
| Week | New ads × budget / ad (proposed) | Weekly test spend | Cumulative | Creators posting | CAC target (proposed) |
|---|---|---|---|---|---|
| 1 | 12 × $250 | $3,000 | $3,000 | 0 | $10 |
| 2 | 12 × $250 | $3,000 | $6,000 | 2 | $10 |
| 3 | 12–20 × $250 | $4,000 | $10,000 | 4 | $10 |
| 4 | 12–20 × $250 | $4,000 | $14,000 | 6 | $10 |
| 5 | 20 × $250 | $5,000 | $19,000 | 8 | $10 |
| 6 | 20 × $250 | $5,000 | $24,000 | 10 | $10 |
Week 1 and week 2 run 12 ads at $250 each, $3,000 a week. Weeks 3 and 4 run 12 to 20 ads, $4,000 a week. Weeks 5 and 6 run 20 ads, $5,000 a week. Total $24,000 of tests, Proposed. Losers die early, so spend moves to what holds.
The math. Week 1: 12 × $250 = $3,000; Week 2: 12 × $250 = $3,000; Week 3: 16 × $250 = $4,000; Week 4: 16 × $250 = $4,000; Week 5: 20 × $250 = $5,000; Week 6: 20 × $250 = $5,000. Total $24,000 (96 ads × $250). A range such as 12–20 counts as its midpoint.
Weeks one and two test what the brand already has, rewritten per reason to buy. From week three, creator videos enter paid only after they beat their own account median. A range of new ads counts as its midpoint in the spend column.
06 Volume
More concepts, more winners: the Assumption behind scale
Twenty concepts yield two winners and $18,000 added monthly at the same hit rate. Eighty yield eight winners and $72,000. Hit rate and spend per winner are Assumptions; more concepts mean more shots at a low CAC.
| Concepts tested / month | Hit rate (assumed) | New winners / month | Spend each winner holds (assumed) | Added spend at target CAC |
|---|---|---|---|---|
| 20 | 10% | 2 | $300 / day | $18,000 / month |
| 40 | 10% | 4 | $300 / day | $36,000 / month |
| 60 | 10% | 6 | $300 / day | $54,000 / month |
| 80 | 10% | 8 | $300 / day | $72,000 / month |
The math. 20 concepts × 10% = 2 winners × $300 × 30 days = $18,000 a month; 40 concepts × 10% = 4 winners × $300 × 30 days = $36,000 a month; 60 concepts × 10% = 6 winners × $300 × 30 days = $54,000 a month; 80 concepts × 10% = 8 winners × $300 × 30 days = $72,000 a month.
The hit rate and the spend each winner holds are placeholders. The first thirty days of tests replace them with real numbers, and the table is recalculated the same day.
07 Allocation
The $100,000 budget follows what wins, not a fixed split
- Meta ads: tests, then scaling the winners
- $55,000
- 55%
- Creator pay and product for the first ten creators
- $25,000
- 25%
- Landing page builds and tests
- $12,000
- 12%
- Reserve for a second channel once Meta holds
- $8,000
- 8%
Out of the $100,000 budget (Proposed), the split moves at each gate toward whatever holds $10.08.
The math. 55% × $100,000 = $55,000; 25% × $100,000 = $25,000; 12% × $100,000 = $12,000; 8% × $100,000 = $8,000. Sum 100% = $100,000.
This split is a proposal. It moves toward scaling as winners prove out, and toward testing when fatigue shows.
08 Channels
Meta first, because printed socks sell on sight
| Channel | Open when (proposed) | Why wait |
|---|---|---|
| Meta | Day one: this is where the tests run. | Printed pairs show well in feed video, and Meta gives the fastest read on hooks. |
| TikTok | When two creator videos hold CAC near $10.08 on Meta. | Creator videos can be reused there, so extra reach needs little extra production. |
| Email and SMS | Once repeat orders are tracked in week one. | The ceiling counts one repeat order, so retention decides whether $10.08 holds. |
| Google Shopping | After Meta winners prove a print at its price. | Search catches people who already want compression socks, at prices like $20.95. |
| Affiliate links | When core ads are steady and reporting is clean. | Creators could earn beyond the first ten; I'd check how the brand's program works first. |
A channel opens when its condition is true, not when the calendar says so. Until then the budget stays where the CAC is earned.
09 Payback
At CAC $20 or $25, a $21 order never pays back
Payback is the real constraint on a $21 order. At a CAC of $5 the first order leaves $11.80. At $10 it takes repeat orders and leaves $6.80. At $20 or $25 it never pays back, and I stop: $3.20 and $8.20 short.
Cumulative margin per customer, order by order, before CAC: $8.40, $16.80.
| CAC (scenario) | First-order margin | Year-one margin | Left after CAC | Payback |
|---|---|---|---|---|
| $5 | $8.40 | $16.80 | $11.80 | First order |
| $10 | $8.40 | $16.80 | $6.80 | After repeat orders |
| $20 | $8.40 | $16.80 | −$3.20 | Never: stop |
| $25 | $8.40 | $16.80 | −$8.20 | Never: stop |
The math. CAC $5: $16.80 − $5 = $11.80 left; pays back: First order; CAC $10: $16.80 − $10 = $6.80 left; pays back: After repeat orders; CAC $20: $16.80 − $20 = −$3.20 left; pays back: Never: stop; CAC $25: $16.80 − $25 = −$8.20 left; pays back: Never: stop.
Read each row left to right: the margin of the first purchase, the margin over the whole horizon, what is left after CAC, and the purchase on which the CAC is earned back. A scenario that never pays back is a stop, not a test.
10 Scope
I build the engine; your team owns tracking and fulfilment
Covers
- Meta ad testing on the printed pairs, with losers killed early
- Creator sourcing, briefs and weekly video review
- Landing pages for each winning print
- Daily CAC, weekly learnings and monthly cohort payback reports
Doesn’t
- Event tracking setup: I spec it, your team builds it
- Fulfilment, stock and shipping
- Product design, pricing and discount decisions
- Anything outside paid social and creators
What this plan covers is what I can change inside the ad account and the creator program. Everything outside it is named on the right so nobody assumes it is handled.
Gates, written before spend, so stopping isn’t a negotiation.
| Day | Keep going if (proposed) | Stop or change if |
|---|---|---|
| Day 14 | Tracking matches store orders and at least four ad concepts have a readable CAC. | Purchase events still do not match store orders. |
| Day 30 | At least one concept holds CAC at or under $10.08 on real spend. | No concept gets near $10.08 after the tests. |
| Day 60 | Winners scale with CAC still at $10.08 and repeat orders confirm the $21 order guess. | CAC rises above $16.80 as spend scales. |
| Day 90 | Cohort payback lands inside the ceiling and creators keep supplying ads at the pace of the ramp. | Cohort payback fails at the $16.80 ceiling. |
Each gate is checked on its day with the numbers in the daily and weekly reports. If the stop condition is true, the spend stops and nothing renews until we talk.
What exists, what’s missing, and the order that’s forced.
| Piece | Exists today | Missing | Forced order |
|---|---|---|---|
| creative | Dozens of prints at $20.95, from Warming Stripes to Boo! | A hook library sorted by occasion | 1st |
| creators | Cool Grey Elite Running Socks at $10.00 | A creator roster and briefs | 2nd |
| claims sheet | Fabric line: 78% Cotton, 20% Nylon, 2% Spandex on quarter socks | Approved wording for compression pairs | Week 1 |
| landing pages | Free shipping over $90 and the FALL75 code | One page per winning print | 2nd |
| reporting | A $90 shipping threshold to measure baskets against | Daily CAC and cohort payback views | 1st |
The order is forced on purpose: creative and creators come first because they are what moves CAC, and everything else waits for that data.
Every number, and where it came from.
| Figure | Where it came from | Type |
|---|---|---|
| $20.95 Price of Warming Stripes and dozens of other printed pairs | https://crazycompression.com/products/warming-stripes-standard-extra-wide | Fact |
| 12 Variants on each printed pair | https://crazycompression.com/products/warming-stripes-standard-extra-wide | Fact |
| 75% Fall sale banner, with code FALL75 | https://crazycompression.com/ | Fact |
| Product prices $10.00–$155.00 | product prices in the site product data (160 products), read 2026-10-05 | Fact |
| $21 average order · 40% margin · 1 repeat order | Placeholders, replaced in week one | Assumed |
| $10.08 target CAC | 0.6 of the $16.80 margin per customer | Calculated |
| $16.80 margin per customer | Price × (margin − discount), summed over the orders | Calculated |
| $24,000 of tests (96 ads × $250) | Danilo’s plan, matches Month one | Calculated |
| 0→10 creators in 6 weeks · 7 videos per creator a week | Danilo’s plan, matches Month one and the Creator engine | Proposed |
| $100,000 first budget split 55% / 25% / 12% / 8% | Danilo’s plan, re-set with the team in week one | Calculated |
| 10% hit rate · $300 a day per winner | Placeholders, replaced by the first 30 days of tests | Assumed |
| 303 creator videos a month at 10 creators | 10 creators × 7 videos a week × 52 ÷ 12 | Calculated |
| $5.74 per 1,000 views against a $1 target | Creator cost over the views the assumptions give | Calculated |
| $1,000 base pay · $50 bonus past 100,000 views | Danilo’s plan | Proposed |
| 1,500 median views · 4% breakout (10×) · 0.5% viral (750,000) | Placeholders, replaced by the first month of posts | Assumed |
| Pay bands $300–$600, $500–$1,000, $800–$1,500 | Danilo’s plan | Proposed |
Every figure on this page is listed here with where it came from. Fact means read on the site. Assumed and Proposed are Danilo’s own numbers, to be replaced in week one. Calculated is plain arithmetic on those, with the formula shown next to it.
Month one is where it starts.
Week one: I read your orders to replace the $21 order, 40% margin and repeat-order guesses. We approve a claims sheet, sort the prints into a hook library, and launch 12 ads at $250 each, with tracking checked before spend rises. One number guards it all: $10.08.